AI Visibility Measurement & Reporting: The Complete Playbook
Measuring AI visibility sounds like one task ("are we showing up in ChatGPT?"), but it's really eight, and most teams track two or three and call it a program. This is the complete version: the eight building blocks of AI visibility measurement, how they fit into a single view, and the reporting mistakes that make good data look like noise. Each block links to a deeper guide, so treat this page as the map.
The eight building blocks of AI visibility measurement
You don't need all eight from day one, but a complete program eventually touches each.
Share of voice
Being mentioned is binary; share of voice is the volume knob. It asks how much of an answer is you versus competitors: being one of two named brands is worth far more than being one of eight. Track it within an engine over time, not across engines, since some models simply name more brands per answer. Full guide: AI share of voice.
Citation analysis
When an engine cites its sources, those citations are a map of exactly which pages earned your mention, or your competitor's. Citation analysis turns "we're not showing up" into "here are the five pages we'd need to be on." It's the most actionable signal you have. Full guide: AI citation analysis.
Hallucination tracking
AI doesn't just omit you; sometimes it says something wrong about you: an outdated price, a discontinued feature, a competitor's claim attributed to you. Hallucination tracking catches these, because a confident wrong answer is worse than no answer at all. Full guide: tracking AI hallucinations.
Executive reporting
The numbers that move a strategy are not the numbers that inform a daily edit. Executive reporting is about cadence and framing: a monthly trend with a confidence band and one clear "so what," not a firehose of prompt-level detail. Full guide: reporting AI visibility to executives.
GA4 referral traffic
Visibility eventually shows up as clicks. Measuring AI referral traffic in GA4 tells you how many real visitors arrive from ChatGPT, Perplexity, and the rest (small in volume today, unusually high in intent). Full guide: measuring AI traffic in GA4.
AI-influenced conversions
The click is only the visible end of a longer story. Many buyers are influenced by an AI recommendation days before they convert through another channel. Attributing that influence, however imperfectly, keeps you from undervaluing the whole effort. Full guide: AI-influenced conversions.
Bot log analysis
Your server logs record every time an AI crawler fetches a page: which bots, how often, and what they can reach. It's the ground truth for whether engines can even see your content before any of the other metrics can matter. Full guide: AI bot log analysis.
Prompt-set design
Every number above depends on which questions you track. A sloppy prompt set measures the wrong thing precisely; a good one mirrors how real buyers actually ask. This is the foundation the other seven blocks stand on. Full guide: how to design a prompt set.
How these metrics fit together in one dashboard
Read in isolation, any one of these is a partial truth. Together they form a chain from cause to effect: prompt-set design decides what you measure, bot logs confirm engines can reach you, citation analysis shows which sources feed the answer, share of voice and hallucination tracking describe how you appear in it, GA4 traffic and influenced conversions show what that presence is worth, and executive reporting compresses the whole thing into a decision.
The practical way to run this is not eight separate spreadsheets but one view where the leading indicators (can we be crawled, are we cited, what's our share of voice) sit next to the lagging ones (traffic, conversions). When a lagging number moves, the leading ones tell you why. That's also the shape of our own scoring methodology: a single visibility score with a confidence band on top, decomposed into the signals that built it. If you'd rather have all of this tracked in one place than assemble it by hand, that's what the paid plans are for.
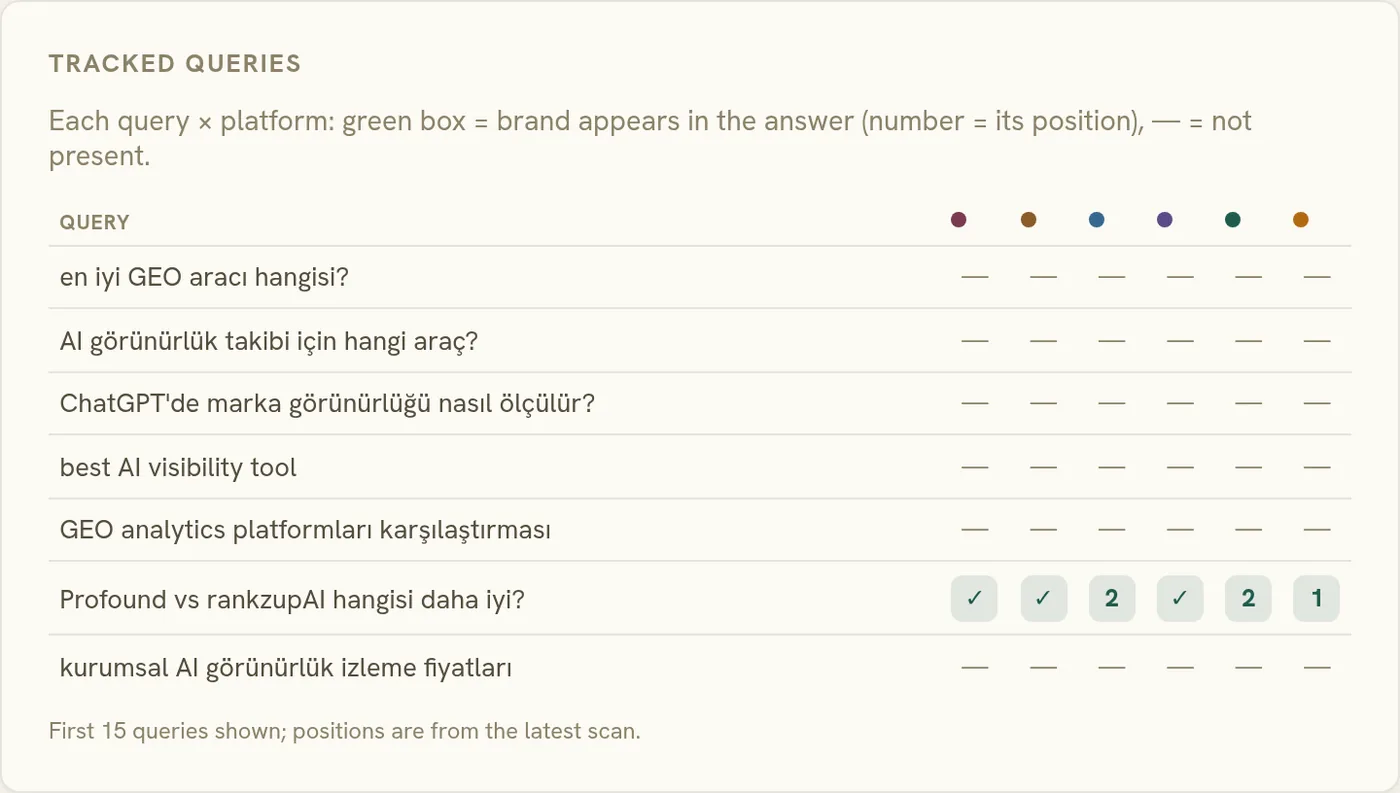
AI search visibility metrics and KPIs at a glance
If you only take one table into a reporting meeting, make it this one. The core AI search visibility metrics: mention rate (share of answers naming you), average position (where you land among the names), share of voice (your slice against named rivals), sentiment ratio (how you are framed), and citation rate (how often your pages are the source). Each ships with a confidence band, because every one of them is sampled from stochastic answers.
As KPIs, they split cleanly: executives get the composite visibility score and share of voice trend; practitioners get per-engine mention rate and per-question position, because that is where the work lives. Teams wiring reports into Claude or n8n can pull these numbers straight from the MCP server. The KPI mistake to avoid is averaging across engines and question types: the blended number hides exactly the gaps you are paid to close.
Common reporting mistakes
A few patterns turn good measurement into misleading reports.
The first is reporting a single number with no band. AI answers vary run to run; a score without a confidence range invites teams to react to noise. Always pair the number with how settled it is.
The second is comparing share of voice across engines. A more verbose engine names more brands and mechanically lowers everyone's share: the comparison is apples to oranges. Compare within an engine over time.
The third is over-reporting to executives. Prompt-level detail belongs in the working view, not the board deck; the executive version is trend, band, and the one decision it implies.
The fourth is measuring only presence and ignoring accuracy. A brand that's mentioned but described wrong has a hallucination problem masquerading as a visibility win. Track both.
Get these right and the eight blocks stop being eight chores and become one honest picture of where you stand in AI answers, and, just as important, what to do about it. For the strategy the measurement serves, start with what generative engine optimization actually is.
For the term itself, see what an AI visibility score is and AI sentiment.
Where to go deeper
Setting it up. The groundwork is in what AI visibility is and how to measure it, how often to measure, which competitors to track and why branded queries inflate a score.
Reading the numbers. Once data starts arriving, three questions come up first: what counts as a good score, what to do when it drops, and how to read a competitor's win.
Funding and tooling. The business case is what gets this work paid for, while AI visibility tools and AEO tools compare what is on the market.