AI Visibility Reports Executives Will Actually Trust
Sooner or later, someone above you asks the question: "How are we doing in ChatGPT?" And the way you answer it the first time sets the tone for every AI visibility report that follows. Answer with a single triumphant number and you've made a promise the data can't keep. Answer with a wall of caveats and you've taught the room to stop reading.
There's a middle path, and it's not a compromise. It's just accurate reporting. AI visibility data is noisy, sampled, and engine-specific, which means some numbers in it are genuinely defensible and others fall apart the moment a sharp CFO pokes at them. The skill is knowing which is which before you put anything on a slide. That's what this piece covers: the AI visibility KPIs that survive scrutiny, the ones that don't, why confidence bands make you look more credible rather than less, a one-page report structure, and what to say when the ROI question lands.
Defensible AI Visibility KPIs vs Numbers That Fall Apart
Start with a simple test for any number you're about to report: if an executive asks "why should I believe this?", can you answer without hand-waving? Some AI visibility metrics pass easily. Others never will, no matter how good your tooling is.
Defensible: trend on a frozen prompt set. "Our mention rate on this engine went from X to Y over three months, measured the same way each period" is a strong claim. The methodology is fixed, the comparison is against yourself, and noise averages out over enough runs. Trends are the backbone of executive reporting because they answer the question executives actually care about (are we getting better or worse) without requiring anyone to believe an absolute number means anything cosmic.
Defensible: share of voice against named competitors. "In answers to our buyer prompts, we're mentioned in 20% of tracked-brand mentions; our biggest rival gets 45%" is comparative, which insulates it from most measurement quirks. Whatever biases exist in the sampling apply to your competitors too, so the gap is more trustworthy than either raw number alone. Executives are also fluent in this framing: share of voice has decades of history in media measurement, and the AI share of voice version inherits that intuition. If you report one competitive number, make it this one.
Defensible: concrete answer changes. "Last quarter, models described us as an X tool; this quarter they describe us as an X tool for Y teams, which matches our positioning", or, on the dark side, "the model is quoting our old pricing." These are observations anyone can verify by asking the engine themselves, which makes them the most persuasive evidence in the whole report. Screenshots of real answers move rooms in a way percentages never do.
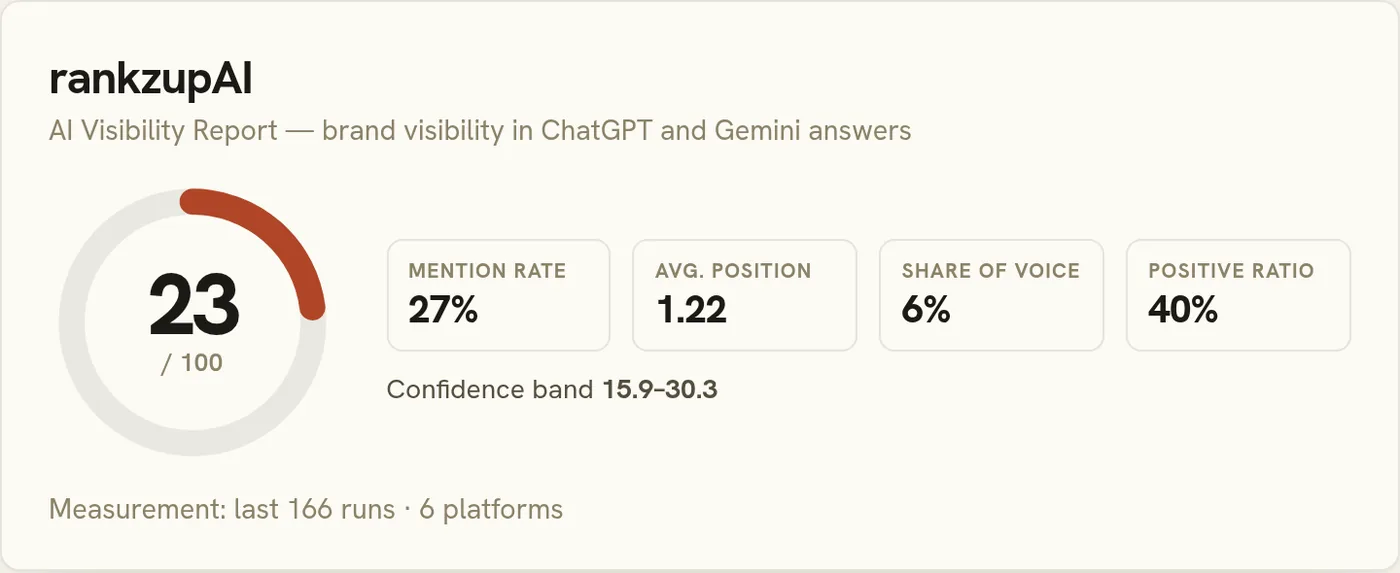
Not defensible: an absolute score presented as gospel. "Our AI visibility score is 72" invites exactly the questions you can't answer: out of what? Says who? Is 72 good? Composite scores are fine as internal compression (a way to watch many signals at once), but the moment one is presented to executives as an objective measurement of reality, you've overpromised. Any score is a function of the prompt set, the engine mix, the sampling depth, and a bundle of weighting decisions. Present it, if at all, as "our index, useful for tracking direction," and link the scoring methodology so the construction is inspectable. A score whose recipe is secret deserves the skepticism it gets.
Not defensible: anything from a single run. One pass over your prompts before the board meeting is a screenshot, not a measurement. Models are non-deterministic; the same prompt yields different brand lists across runs. If the number can change materially by pressing the button again, it doesn't belong on a slide.
Not defensible: cross-engine blended averages. A single percentage averaged across engines with different verbosity and grounding behavior isn't a measurement of your brand: it's a measurement of the blend. Report per engine, always.
Confidence Bands Are a Feature of Your AI Visibility Report
Here's the counterintuitive part: showing uncertainty makes your report more credible with senior audiences, not less. Executives sit through forecasts, market sizing, and survey data all day. They know real-world measurement has error bars, and they've learned to distrust suspiciously precise numbers from new categories of tooling. A share of voice reported as "28%, plausibly anywhere from 24 to 32 given our sample size" reads as the work of someone who understands their own data. "28.4%" reads as someone who doesn't.
Bands also do practical work: they pre-empt the awkward month. Sooner or later a metric will dip for no reason: sampling noise, a model update, an engine having a chatty week. If you've been reporting point estimates, that dip is a crisis requiring explanation. If you've been reporting bands, the dip lives inside the band and the conversation stays calm: "within normal variation, no action needed." You've effectively taught the room the difference between noise and signal, which means when you do flag something as real (a sustained multi-period decline, a competitor surging across engines), the flag carries weight.
You don't need formal statistics to do this honestly. A plain-language version works: state your sampling depth, show the range across recent runs, and commit to a rule like "we call it a trend after three consecutive periods moving the same direction." The specific convention matters less than declaring it in advance and sticking to it.
A One-Page AI Visibility Report Structure
Executives don't read dashboards; they read one page, and they mostly read the top of it. Here's a structure that fits everything defensible onto a single page:
- Headline sentence. One line of interpretation, not data: "AI visibility improved on two of four engines this quarter; the gap to [main competitor] narrowed but remains large." If they read nothing else, this is the takeaway.
- Trend block. Mention rate and share of voice per engine, current period vs prior periods, with bands. Small multiples, not one blended chart.
- Competitive block. Share of voice standings against the named competitor set, plus any surprise brands the models keep recommending. Executives consistently find the surprise entrants the most interesting row on the page.
- Evidence block. Two or three verbatim answer excerpts: one win, one problem. This is where accuracy issues surface too: if a model is misstating your pricing or features, it goes here, because it's a business risk, not a vanity metric.
- Actions and asks. What you did last period, what moved (with honest attribution: "likely contributed" beats "caused"), what you're doing next, and what you need.
Everything else (full prompt-level data, per-run detail, methodology) lives in an appendix nobody is forced to read but anyone can audit. If you're an agency doing this for clients, the same structure works with one addition: a standing methodology page so every number is traceable. Our agency GEO services guide covers how that reporting relationship works in practice.
A hypothetical example of the headline discipline: say a made-up HR platform, Staffly, sees its share of voice jump five points in a month on one engine. The tempting headline is "AI visibility up 5 points." The defensible headline is "Share of voice up 5 points on [engine], within one period, watching to confirm it holds before calling it a trend." Two months later, if it held, Staffly gets to report a real trend and has demonstrated it doesn't cry wolf. That second asset compounds.
Answering the ROI Question Without Overselling
The question will come ("what's this worth in revenue?"), and the worst answers are the extreme ones. Claiming a precise revenue figure from AI visibility is indefensible with today's attribution, and a sharp executive will know it. Claiming it's unmeasurable brand fluff invites the budget cut.
The honest answer has three parts. First, the mechanism: AI answers increasingly shape shortlists before buyers ever reach your site, and absence from those answers is invisible lost pipeline. You never see the deals you weren't considered for. Second, the directional evidence you can show: AI referral traffic and its conversion behavior, branded search movement alongside visibility gains, "how did you hear about us" responses mentioning ChatGPT or Perplexity. These don't sum to a clean ROI number, and you should say so plainly. The case for why lives in our piece on AI-influenced conversions. Third, the cost framing: measurement and improvement here is cheap relative to paid channels, and the alternative (not knowing what models tell your buyers about you) has its own risk price, especially when those models get facts wrong.
"We can't give you a precise ROI number yet, and neither can anyone selling this: here's the directional evidence, and here's the risk of flying blind" is a stronger position than a made-up multiplier. Executives fund plenty of things on that basis. What they don't forgive is a confident number that later turns out to be theater. Report the defensible, band the uncertain, and skip the gospel. That's the whole method.
This is one of eight metrics in the complete AI visibility measurement playbook.