AI Share of Voice: What It Is and How to Measure It Honestly
Share of voice used to mean your slice of ad impressions or search results. In AI answers, it means something more specific and, I'd argue, more honest: when a model answers the questions your buyers ask, what fraction of the brand mentions are yours versus your competitors'? That's the number executives actually want when they ask "how are we doing in ChatGPT", not "do we appear," but "do we appear more or less than the companies we lose deals to."
It's also a number that's very easy to compute badly. Sampling too little, mixing engines, cherry-picking prompts: each produces a confident-looking percentage that's basically noise. So this piece covers what AI share of voice really measures, how to compute it in a way you can defend, and the pitfalls I see most often.
What AI Share of Voice Actually Measures
The definition I use: across a fixed set of buyer-relevant prompts, run repeatedly on a given engine, AI share of voice is your brand's mentions as a percentage of all tracked-brand mentions in the answers. If the answers across your sample mention your brand 30 times and your three competitors 70 times combined, your share of voice is 30%.
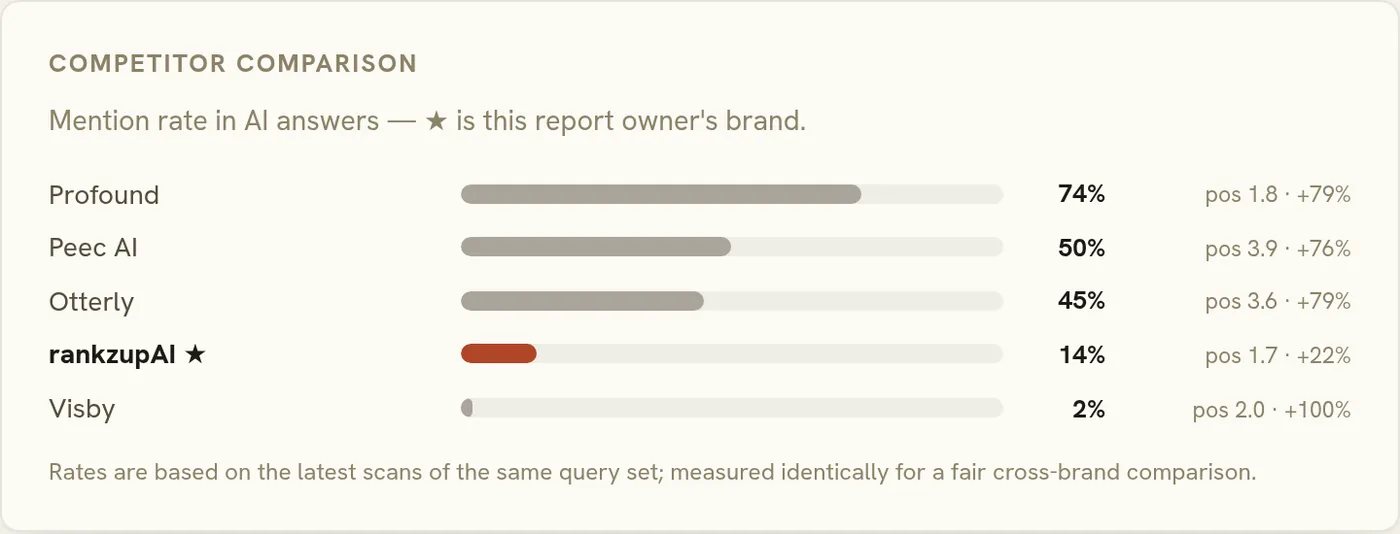
Notice what this is not. It's not "percentage of prompts where we appear": that's mention rate (or visibility rate), a related but different metric. Mention rate tells you how often you show up at all; share of voice tells you how you stack against named competitors in the same conversational space. You want both, and confusing them leads to bad conclusions. A brand can appear in 80% of answers (great mention rate) while being one name in every five-item list a model produces (mediocre share of voice), or appear in only 40% of answers but be the sole recommendation each time.
Why it matters more in AI answers than it did in classic search: a search results page has ten blue links and everyone's technically "present." An AI answer is a synthesized shortlist (often two to five names), and being off it isn't page two, it's nonexistence. Share of voice captures your standing inside that shortlist, which is where buying decisions are increasingly being framed. For the broader measurement picture, our AI visibility guide covers the full metric stack; share of voice is the competitive slice of it.
How to Compute AI Share of Voice Honestly
The honest version has four ingredients, and skipping any of them quietly corrupts the number.
A fixed, buyer-shaped prompt set. Fifteen to forty prompts that mirror how your actual buyers ask: "best X for Y," "alternatives to Z," "is A or B better for teams like mine." Write them once, freeze them, and change them rarely (and version the change when you do, or your trend line breaks). The temptation to add prompts you happen to win is real and must be resisted, because the point is measurement, not reassurance.
Repeated runs, because models are non-deterministic. Ask the same engine the same question five times and you'll get different brand lists (same question, same day). A single run per prompt isn't a measurement; it's an anecdote. You need multiple samples per prompt per period, aggregated, before the percentage means anything. How many depends on how much the answers vary in your category, but if your week-over-week number swings wildly on stable prompts, that's your sampling telling you it's too thin.
A declared competitor set. Share of voice is always relative to somebody. Pick the competitors you actually compete with (the ones in your deals, not the ones in your aspirations) and count mentions across the whole set. Also track the unexpected names models bring up, because models routinely recommend brands you don't consider competitors, and those surprise entrants are genuinely useful market intelligence.
Consistent counting rules. Decide up front what counts as a mention: does an "avoid this one" mention count (I'd say track it, flagged by sentiment, because a negative mention is not the same asset as a positive one)? Does appearing only in a citation link, but not the answer text, count? There's no single right answer, but there is a wrong approach: deciding case by case, after seeing the results. Write the rules down before you look. Our scoring methodology documents exactly how we make these calls, and I'd encourage the same transparency from anyone whose numbers you're asked to trust.
Do all four and you get a percentage per engine, per period, that you can compare to itself over time. That self-comparison is the entire value. Which brings us to the biggest pitfall.
Why You Can't Compare Share of Voice Across Engines
This one deserves its own section because it produces the most misleading dashboards I see: a single blended "AI share of voice: 34%" averaged across ChatGPT, Perplexity, Gemini, and friends.
Engines differ in verbosity and answer style in ways that mechanically change the arithmetic. One engine tends toward long, exhaustive roundups naming eight brands per answer; another gives terse responses naming two. In the verbose engine, mentions are cheap: everyone's share compresses toward the middle because the denominator is stuffed. In the terse engine, mentions are scarce and shares polarize. A 25% share on the terse engine might reflect a much stronger position than 25% on the verbose one. Averaging them adds noise to noise, and a shift in the blend (one engine gets chattier after a model update) shows up as a "trend" in your brand's performance when nothing about your brand changed.
Grounding differences make it worse. Engines that retrieve live sources reflect this week's web; answers leaning on training data reflect a snapshot of the past. Those aren't the same measurement window, so they're not the same measurement.
The honest presentation is per-engine share of voice, each tracked against its own history and its own competitor comparison. Cross-engine, the legitimate comparison is directional ("we're strong in Perplexity, weak in Gemini, and here's who's beating us there"), not numerical. It's a less satisfying dashboard. It's also the one that's true.
Other Pitfalls That Quietly Skew the Number
A few more failure modes worth naming, briefly:
- Snapshot theater. Running the prompt set once before a board meeting and presenting the result as "our AI share of voice." Without repeated sampling and a time series, it's a screenshot, not a metric.
- Ignoring position and framing. Being first and recommended is different from being last with a caveat. Raw mention counts flatten that; at minimum, track prominence or sentiment alongside share.
- Prompt survivorship. Quietly retiring prompts where you perform badly. The trend line goes up and means nothing.
- Reading noise as signal. With honest sampling you'll still see small fluctuations. A two-point wiggle week over week is probably nothing; treat only sustained, multi-period movement as real.
- Personalization and locale blindness. Answers can differ by country and context. Measure from a consistent, neutral setup, and note it in your methodology.
What a Good Baseline Looks Like
A useful first baseline isn't one number. It's a small table you'll compare everything against later. Concretely, a hypothetical example: say a made-up scheduling tool, Calendrix, tracks 25 prompts against three competitors. After a proper multi-run sample, its baseline might look like: 18% share of voice on one engine (third of four brands, mostly mid-list mentions), 31% on another (second of four, often top-two), with one competitor dominating everywhere and one surprise brand appearing that Calendrix never considered a rival. That's a real baseline: per-engine numbers, rank within the competitor set, prominence notes, and at least one surprise. Anyone presenting a baseline with no surprises in it probably hasn't looked closely.
Expectations worth setting at baseline time: in most categories one or two incumbents hold outsized share, because models favor consensus picks. Don't panic at a low starting number, since the baseline's job is to be improved on, not to flatter. Expect asymmetry across engines; uniform numbers everywhere would actually be suspicious. And expect the first month of data to teach you more about your prompt set than about your brand. You'll refine wording, spot ambiguous prompts, and tighten counting rules. That's normal. Freeze the set properly after that shakedown and let the trend line accumulate.
From there, the loop is simple to describe and slow to run: measure, pick the engine-and-prompt cluster where you're weakest relative to effort, do the off-site and content work that moves it, and re-measure next period. Share of voice is the scoreboard for that loop, not a lever you pull directly.
If you want a starting number without building the sampling pipeline yourself, run a free GEO audit. It samples the major engines against your competitor set and gives you a defensible baseline to improve on.
This is one of eight metrics in the complete AI visibility measurement playbook.
New to the term? Start with what share of voice in AI search means.